In Part 4 of our Miami Bridge collapse series we discussed how bridge design is, simplistically speaking, a process of ensuring that the ‘actions’, e.g., forces, in each member or connection of a structure are lower than their capacity to resist those actions.
We also learned about the Member 11 to 12 deck joint, the bridge connection that failed explosively and initiated the collapse, and how the designers of the bridge, FIGG, made a serious design error by underestimating the action at this critical connection.
In this part of our series, we look at the other significant design error made by FIGG – overestimating the capacity (or strength) of this very same connection.
The Cold Joint
The capacity of a connection is a measure of its ability to resist an action – the higher the capacity, the more action it can resist.
But how do engineers calculate the capacity of a connection like the Member 11 to 12 deck joint?
To understand this part of the process we need to begin with how this connection was constructed. You can’t think of this connection as one solid piece of concrete. Firstly, the deck was poured and allowed to set. Then the twelve vertical and diagonal truss members were poured and also allowed to set. Finally, the bridge’s canopy was poured, and it too was allowed to set.
This process of three separate pours results in joints between the pours, which are called cold joints – see figure.

This means that where Members 11 and 12 connect to the deck, there is a horizontal joint. This is not necessarily a problem, but the designers do need to ensure that this joint, this line of weakness, is taken into account when they’re calculating the capacity of the joint. In very simple terms, they need to ensure that Members 11 and 12 don’t slide horizontally relative to the deck.
How can this relative movement be prevented?
Firstly, reinforcing bars are placed across the cold joint and then the friction between the joint surfaces is considered. The factors that affect this friction are:
- Joint Roughness: If the joint is very rough, this creates friction between the surfaces, which helps prevent sliding.
- Joint Clamping Force: The larger the force pressing the joint together, the more friction exists between the surfaces, which helps prevent sliding.
So, in order to determine the capacity of the connection, you need to calculate the roughness and the clamping force.
Roughness
A designer can specify a certain roughness for the concrete surfaces when designing the joint. The bridge contractor then roughens the surfaces to the required level before the next pour is undertaken.
FIGG specified a certain roughness and noted it on their drawings. But while they noted it on some drawings, they didn’t note it on the construction drawings. So, when the contractor, MCM, didn’t see a note to roughen the joint, they didn’t do so.
By falsely assuming the joint was roughened, FIGG calculated a higher capacity for this joint than it possessed in practice.
The Clamping Force
The second consideration is the clamping force across the joint. The higher the clamping force, the higher the friction, which leads to a joint being less likely to slide. Therefore, when the clamping force is greater, the joint possesses greater capacity (to resist the sliding action).
What generates this clamping force?
In the case of the Member 11 to 12 deck joint, the weight of the bridge above the connection generates the force by pressing the two surfaces together.
But the National Transportation Safety Board (NTSB) identified numerous errors in FIGG’s calculation of this clamping force. FIGG overestimated the clamping force, therefore assuming that the capacity of the joint to withstand sliding actions was greater than it actually was.
FIGG calculated the clamping force inappropriately in two ways.
Firstly, they included some loading that was not going to be present on the bridge all the time, namely, the pedestrian load. The pedestrian load adds more weight to the bridge, which in turn increases the clamping force. But because this pedestrian load will not always be on the bridge, the additional clamping force it generates will not be there either. And when it’s not, the clamping force will be lower than what was assumed by FIGG.
Secondly, FIGG used an inappropriate load factor to calculate the clamping force.
What is a load factor?
In the design process, designers not only calculate actions and capacities; they also apply factors to these values. These factors are included to achieve a safer bridge – or as engineers would say, achieve a design with the appropriate reliability. For example, a load factor is typically applied to loads to make them larger, to amplify them – thus deliberately overestimating the loading on the bridge.
FIGG made an error in the selection of the load factor they applied, which led to an overestimate of the clamping force.
How did this happen?
FIGG could choose from two load factors to apply: 1.25 or 0.9.
They applied a value of 1.25, meaning they multiplied their loading by 1.25 to make it artificially larger by 25%. But the design code states that the applied load factor should generate the most adverse case for the bridge. Applying an extra 25% of load will usually generate the worst case – except when it comes to calculating the clamping force.
In this case, they shouldn’t have selected a load factor of 1.25, but should have used 0.9 instead. Multiplying the loading by 0.9 – applying only 90% of it – would have resulted in a lower clamping force and less assumed friction between the surfaces.
By adding an extra 25% to the clamping force calculations, the designers were actually making the bridge less safe. By assuming there was more friction between the surfaces than there actually was, they overestimated the capacity of the connection.
The Consequences of the Action/Capacity Errors
In the design of this connection, FIGG assumed that the bridge had extra capacity because of roughening, which it didn’t have in practice, and they also assumed it had more than an extra 25% in clamping force, which it didn’t have either.
This meant that the bridge appeared to have a higher capacity in the design calculations than it did in real life. FIGG overestimated the capacity, and at the same time, as discussed in Part 4, they underestimated the action at the critical connection by a significant amount. (They should have selected an action about twice what they used.)
As we discussed, an appropriately designed bridge should have actions in each member and connection of the structure that are smaller than the member and connection’s capacity to resist these actions.
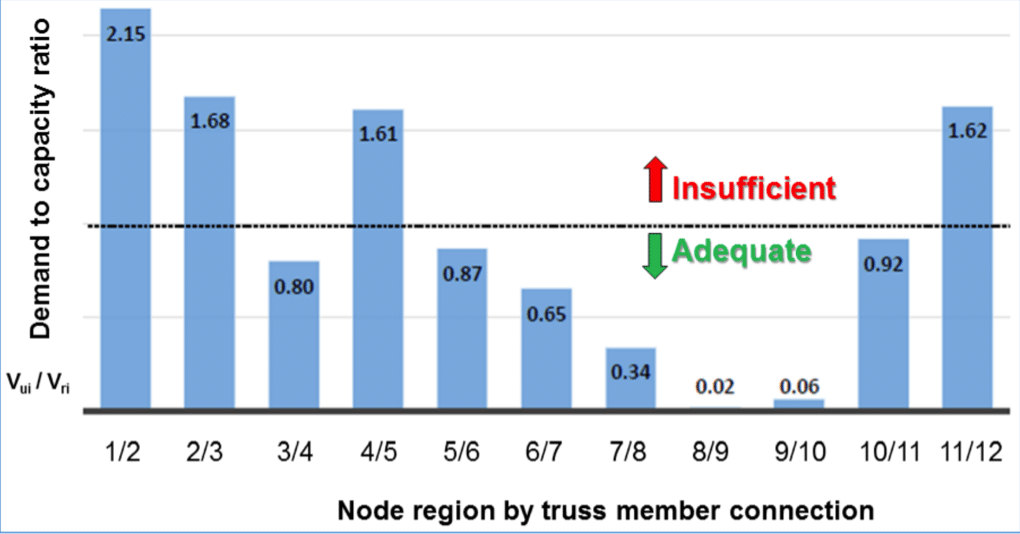
Following the collapse, the investigation team recalculated the actions and capacities of the members and connections to determine how deficient the bridge’s design actually was. They calculated the demand to capacity ratio for each connection, which is the ratio of each connection’s action to its capacity. A value of less than 1 is acceptable because this means the action is less than the capacity, whereas a value greater than 1 means the action exceeds the capacity.

Examining the Member 11 to 12 deck joint connection on the right, you’ll see the action exceeds the capacity by 62%. And this was not the only connection with design errors – the Member 1/2, 2/3, and 4/5 connections were also inappropriately designed. This was a bridge with systemic design issues.
These issues led to overloaded joints that cracked when the bridge first carried its own weight in the casting yard, culminating in a joint that catastrophically failed when the post-tensioning rods in Member 11 were re-tensioned on 15 March 2018.
What are the Lessons?
Why were so many design errors made? And why didn’t anyone go back and examine the design calculations when the bridge began to crack in the weeks leading up to the failure? And why did the design review process fail to pick up these errors?
In our next and final part of the series, we’ll try to make sense of this failure, not only from a technical perspective, but also from the perspective of how investigations like these should be undertaken in the future.
To learn more check out Part 1, Part 2, Part 3 and Part 4 of the Miami Bridge Collapse series.
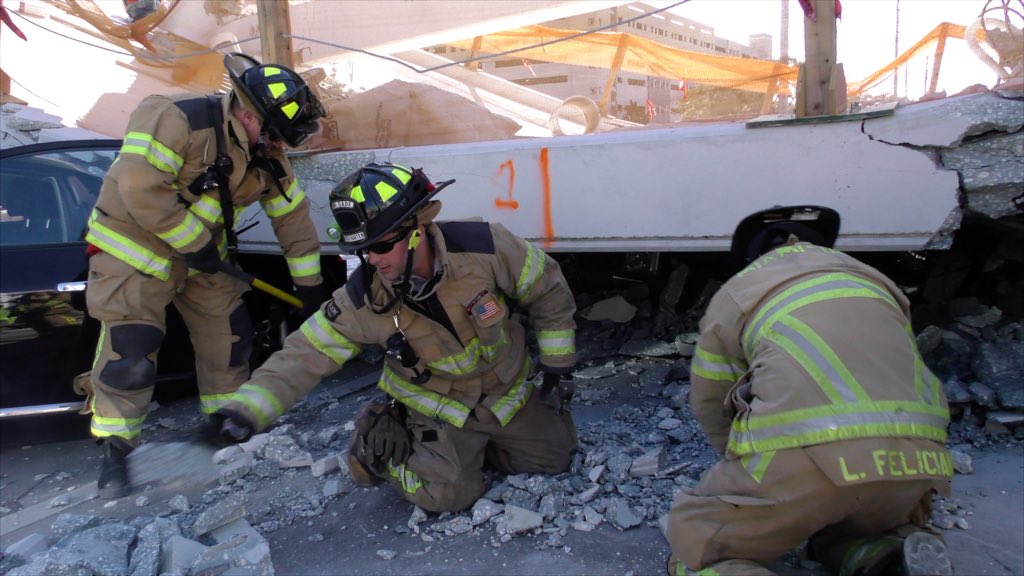
Photo: Miami-Dade Fire Rescue
Diagrams taken from the NTSB investigation report

